PROCESS OPTIMIZATION THROUGH DATA VISUALIZATION

Unlock Process Insights and Enhance Process Performance

with zenphi’s powerful Tables and Dashboards to elevate your operations, track process metrics, and make informed decisions.

Empower Your Team With Process Optimization

Zenphi’s process automation solution leverages advanced analytics, customizable Tables and Dashboards to drive efficiency, enhance process performance and enable optimization. Capture key process metrics, visualize trends, and gain valuable insights for informed decision-making. Beyond automation, zenphi empowers you to fine-tune and optimize your processes for maximum productivity.

Tables: Your Robust Data Management Solution.

Tables serve as a robust database, empowering you to automatically capture, store, and structure key information from your processes:

1. CREATE YOUR TABLE

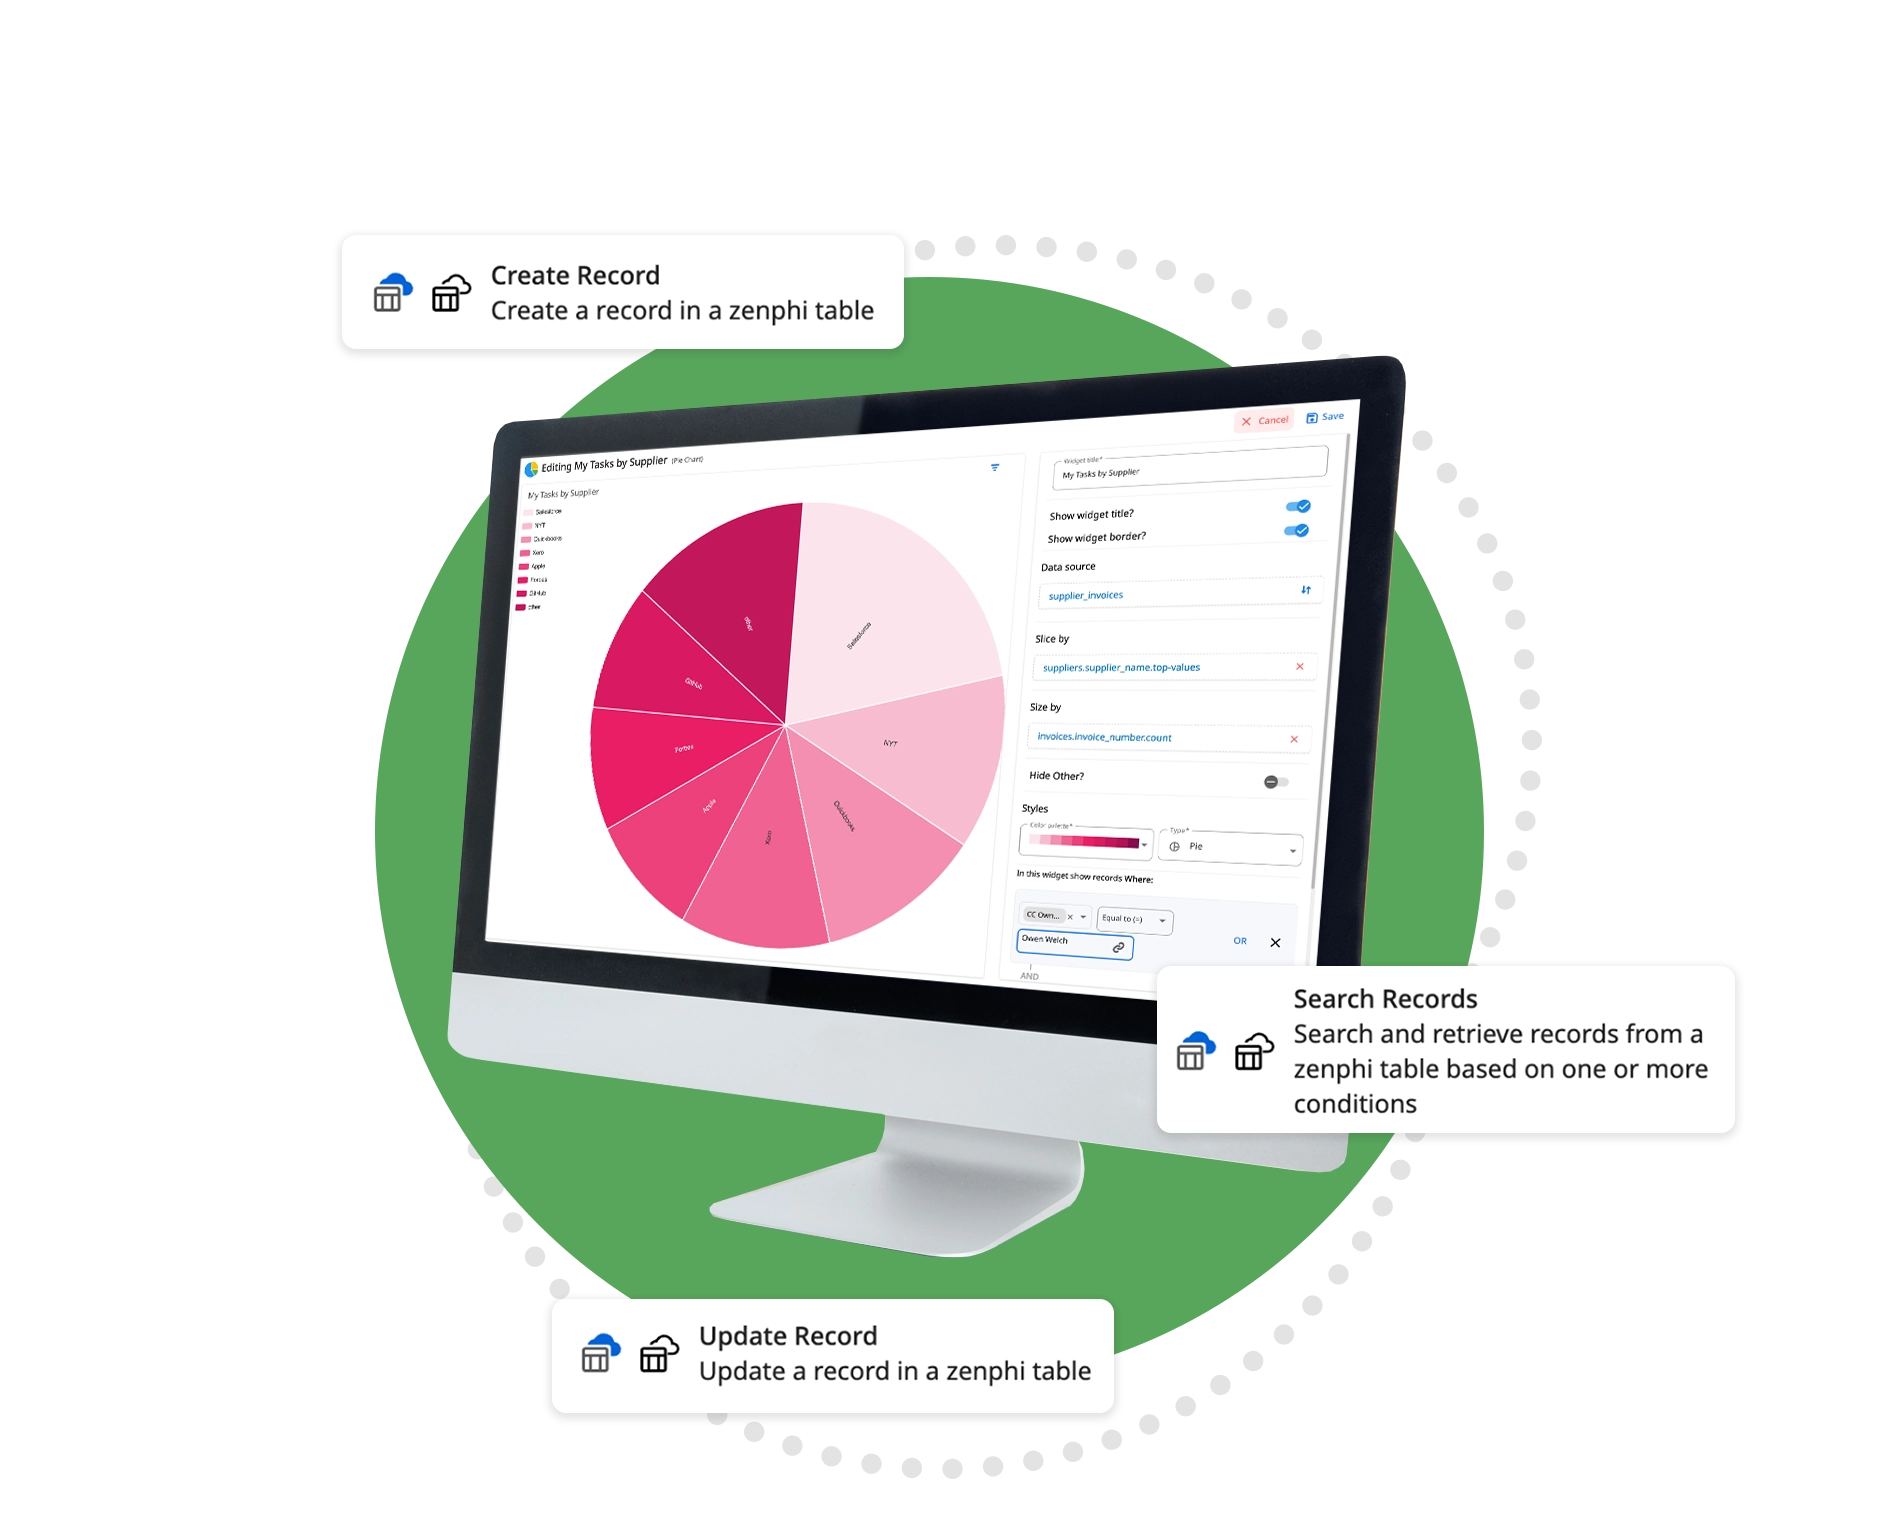
Begin by creating your custom table, specifying the columns and data types for each column that aligns with your needs, whether it be a single line and long text, URL, single select, multiselect, integer number, decimal number, currency, percent, boolean, date/time, or attachment.

2. STREAMLINE DATA MAPPING

Map out the data you wish to seamlessly transfer from your automated Flows into your Tables using the dedicated Tables actions. Capture any process data, including record IDs, dates, statuses, and much more.

3. AUTOMATED DATA ROUTING

Witness your data effortlessly navigate through each automated execution, guaranteeing you have reliable and readily accessible information at your fingertips when you need it. 

HOW ZENPHI TABLES SETS ITSELF APART FROM GOOGLE SHEETS

Diverse data types for enhanced flexibility

Zenphi Tables offer a wide range of data types, making it a breeze to capture and manipulate data as needed. Whether you need to perform mathematical operations or calculate differences, Tables have you covered.

Fuel for zenphi Dashboards

Data from your zenphi Tables powers your built-in Dashboards to provide interactive charts that enable you to display and act on your most crucial metrics.

Trigger automations right from your Tables

Adding a new layer of interactivity to your Tables is easy! Simply create a custom button within your Tables widget, choose the corresponding Flow to activate, and initiate automated workflows from any record. 

Dashboards: Real-time Performance Visualization Through Charts, Graphs & Other Widgets

Setting up your personalized Dashboards is a breeze. Simply follow these steps and make edits at any time:

1. CREATE YOUR DASHBOARD PAGE

Begin by creating your Dashboard page and widgets. Add as many widgets as your process needs, including series charts, pie charts, grids, lists, kanban, calendars, metrics, gauge charts & web pages.

2. CUSTOMIZE YOUR WIDGETS

Specify the data source Table, select your preferred style, apply filters, and tailor the widget to your exact specifications.

3. CONFIGURE DETAILED PAGES

Set up detailed pages to display individual Table records directly from your widgets, providing comprehensive insights as needed.

4. START COLLABORATING

Invite process stakeholders and monitor process performance in real time. Identify bottlenecks, inefficiencies and opportunities for improvement, enabling you to make data-driven decisions to streamline workflows and boost efficiency.

Supercharge Your Operations and Achieve Process Excellence with Data-driven Insights

EMPOWER YOUR BUSINESS WITH PROCESS OPTIMIZATION

Experience the powerful duo of no-code Business Process Automation (BPA) and zenphi’s robust Tables and Dashboards to revolutionize your process optimization journey, streamline workflows, and drive peak performance. 

From identifying process bottlenecks to enhancing productivity, zenphi empowers you to optimize your operations with precision.

ACTIONABLE INSIGHTS FOR SUPERIOR PERFORMANCE

Zenphi’s Tables and Dashboards offer comprehensive visualization and analytics capabilities for your automated processes. Access a range of process metrics, track KPIs, and gain insights to fine-tune your workflows and proactively manage outcomes to ensure uninterrupted performance throughout the year.

FLEXIBILITY & CUSTOMIZATION FOR TAILORED PROCESSES & REPORTING

Select and track only the essential process metrics that align with your growth goals. Craft your personalized, interactive Dashboards swiftly, and effortlessly share them with your team. Create multi-layered process dashboards for an in-depth, granular perspective.

ENABLE COST SAVINGS

Automate, analyze, and enhance your processes—all within a single, unified platform, with no extra software needed. Optimize resource utilization & amplify your ROI with seamless, streamlined workflows.

CONTINUOUS IMPROVEMENT

Empower your team to continuously optimize processes based on real-time insights enabling you to adapt and enhance workflows to meet changing business needs and goals.

Flexible automation,
trusted by teams of all sizes

Talk to us

Book in a free, no-obligation call with one of our friendly Automation Experts.